
Passenger and air cargo demand growth modest in June

Image courtesy IATA
Total passenger demand, measured in revenue passenger kilometres (RPK), was up 2.6% compared to June 2024. Total capacity, measured in available seat kilometres (ASK), was also up 3.4% year-on-year. The June load factor was 84.5% (-0.6 ppt compared to June 2024).
International passenger demand rose 3.2% compared to June 2024. Capacity was up 4.2% year-on-year and the load factor was 84.4% (-0.8 ppt compared to June 2024), whilst domestic passenger demand increased 1.6% compared to June 2024. Capacity was up 2.1% year-on-year. The load factor was 84.7% (-0.4 ppt compared to June 2024).

Willie Walsh (above), IATA’s Director General said: “In June, demand for air travel grew by 2.6%. That’s a slower pace than we have seen in previous months and reflects disruptions around military conflict in the Middle East. With demand growth lagging the 3.4% capacity expansion, load factors dipped 0.6 percentage points from their all-time record-high levels. At 84.5% globally, however, load factors are still very strong. And with a modest 1.8% capacity growth visible in August schedules, load factors over the Northern summer are unlikely to stray far from their recent historic highs.”
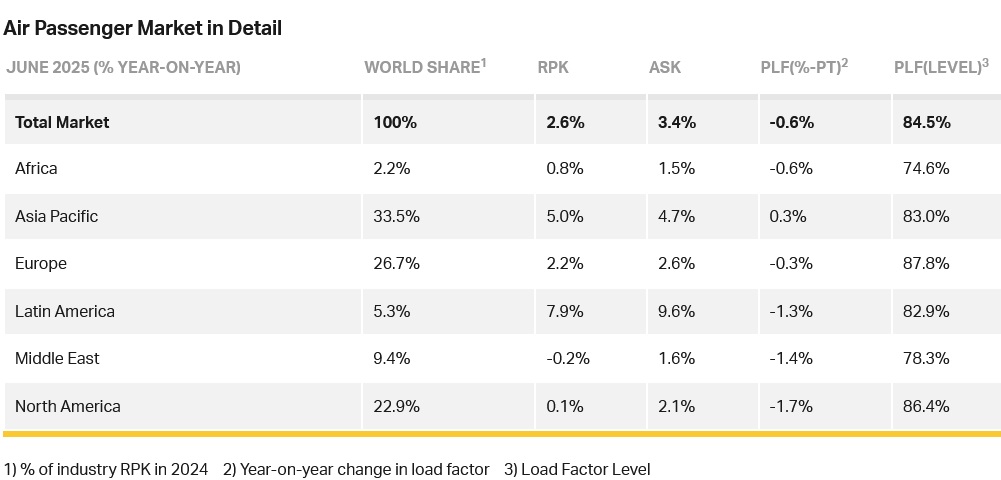
International RPK growth reached 3.2% in June year-on-year, but load factor fell across all regions as capacity growth outstripped demand. The steepest fall in RPK growth from May was in the Middle East, where international traffic contracted 0.4% year-on-year, impacted by military conflict.
Asia-Pacific airlines achieved a 7.2% year-on-year increase in demand. Capacity increased 7.5% year-on-year, and the load factor was 82.9% (-0.2 ppt compared to June 2024).
European carriers had a 2.8% year-on-year increase in demand. Capacity increased 3.3% year-on-year, and the load factor was 87.4% (-0.4 ppt compared to June 2024).
North American carriers saw a 0.3% year-on-year fall in demand. Capacity increased 2.2% year-on-year, and the load factor was 86.9% (-2.2 ppt compared to June 2024).
Middle Eastern carriers saw a 0.4% year-on-year decrease in demand. Capacity increased 1.1% year-on-year, and the load factor was 78.7% (-1.2 ppt compared to June 2024). Military conflict particularly impacted traffic on routes to North America (-7.0% year-on-year) and Europe (-4.4% year-on-year).
Latin American airlines saw a 9.3% year-on-year increase in demand. Capacity climbed 11.8% year-on-year. The load factor was 83.3% (-1.9 ppt compared to June 2024).
African airlines saw a 0.3% year-on-year decrease in demand. Capacity was up 0.3% year-on-year. The load factor was 74.6% (-0.5 ppt compared to June 2024). The decline in African load factor may be due to increased competition from European and Middle Eastern carriers.
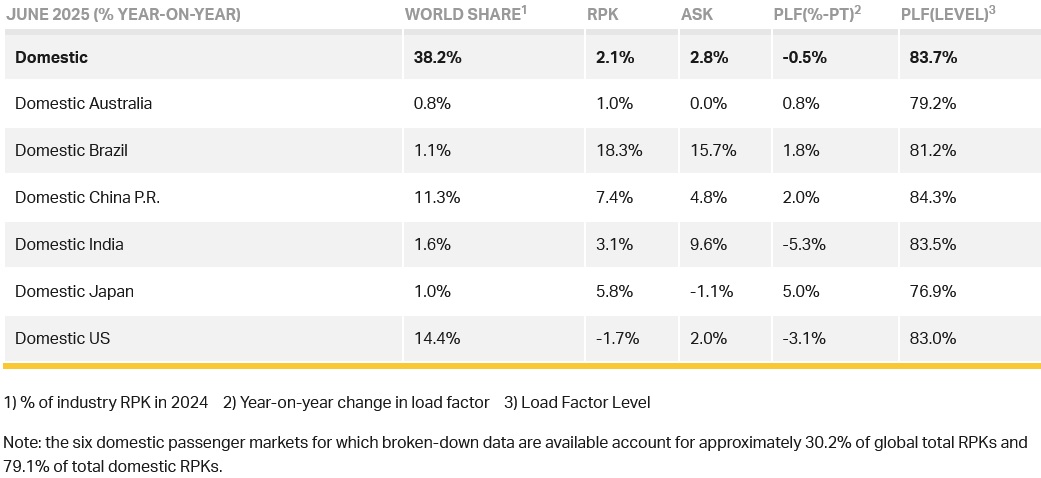
Domestic Passenger Markets
Domestic RPK rose 1.6% over June 2024 and load factor fell by 0.4 ppt to 84.7% on the back of a 2.1% capacity expansion. Brazil was the standout performer, and the US domestic market saw a very slight expansion for the first time in four months.
Air Cargo
IATA's data for June 2025 global air cargo markets showed total demand, measured in cargo tonne-kilometres (CTK), rose by 0.8% compared to June 2024 levels (1.6% for international operations). Capacity, measured in available cargo tonne-kilometres (ACTK), increased by 1.7% compared to June 2024 (2.8% for international operations).
Willie said: “Overall, air cargo demand grew by a modest 0.8% year-on-year in June but there are very differing stories behind that number for the industry’s major players. Trade tensions saw North American traffic fall by 8.3% and European growth stagnate at 0.8%. But Asia-Pacific bucked the trend to report a 9.0% expansion. Meanwhile disruptions from military conflict in the Middle East saw the region’s cargo traffic fall by 3.2%.
“The June air cargo data made it very clear that stability and predictability are essential supports for trade. Emerging clarity on US tariffs allows businesses greater confidence in planning. But we cannot overlook the fact that the ‘deals’ being struck are resulting in significantly higher tariffs on goods imported into the US than we had just a few months ago. The economic damage of these cost barriers to trade remains to be seen. In the meantime, governments should redouble efforts to make trade facilitation simpler, faster, cheaper and more secure with digitalisation.”
Several factors in the operating environment should be noted:
- Year-on-year, world industrial production rose 3.2% in May and global goods trade grew by 5%.
- The June jet fuel price was 12% lower year-on-year, a fourth consecutive year-on-year monthly decline. It was, however, 8.6% up on May prices.
- Global manufacturing rebounded in June, with the PMI rising above the 50 mark to 51.2. The PMI for new export orders improved by 1.2 index points but remained in negative territory (49.3), under pressure from recent US trade policy shifts.
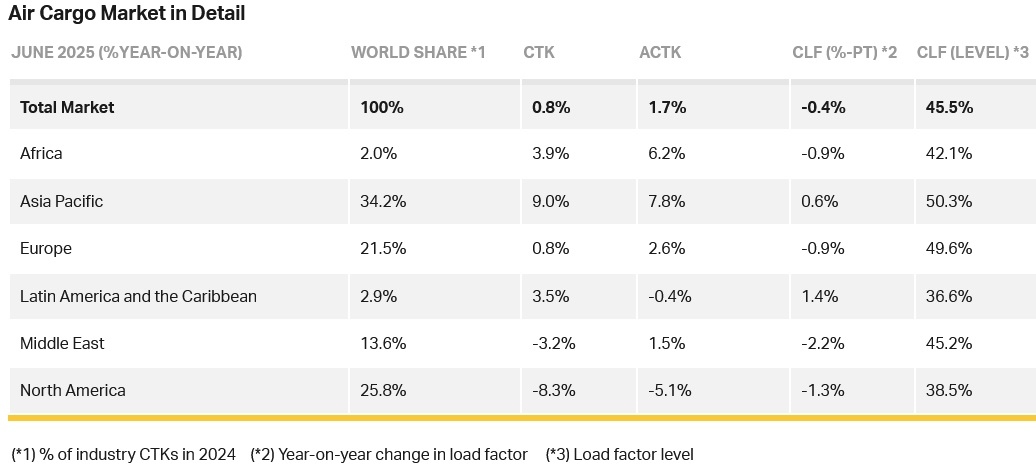
Asia-Pacific airlines saw 9.0% year-on-year demand growth for air cargo in June, the strongest growth of all regions. Capacity increased by 7.8% year-on-year.
North American carriers saw an 8.3% year-on-year decrease in growth for air cargo in June, the slowest growth of all regions. Capacity decreased by 5.1% year-on-year.
European carriers saw 0.8% year-on-year demand growth for air cargo in June. Capacity increased 2.6% year-on-year.
Middle Eastern carriers saw a 3.2% year-on-year decrease in demand for air cargo in June. Capacity increased by 1.5% year-on-year.
Latin American carriers saw a 3.5% year-on-year increase in demand growth for air cargo in June. Capacity decreased by 0.4% year-on-year.
African airlines saw a 3.9% year-on-year decrease in demand for air cargo in June. Capacity increased by 6.2% year-on-year.
Trade Lane Growth: Air freight volumes in June 2025 increased for major trade corridors from/within Europe and Middle East-Asia. However, other relevant trade routes from/within Asia and from North America have decreased significantly in the most recent month.