
IATA reports strong passenger demand and cargo growth in March

Image courtesy IATA
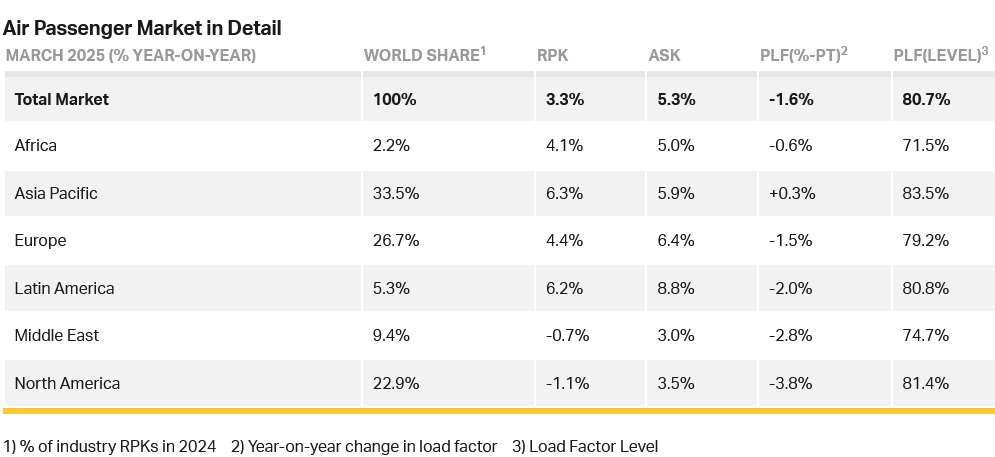
Total demand, measured in revenue passenger kilometres (RPK), was up 3.3% compared to March 2024. Total capacity, measured in available seat kilometres (ASK), was up 5.3% year-on-year. The March load factor was 80.7% (-1.6 ppt compared to March 2024).
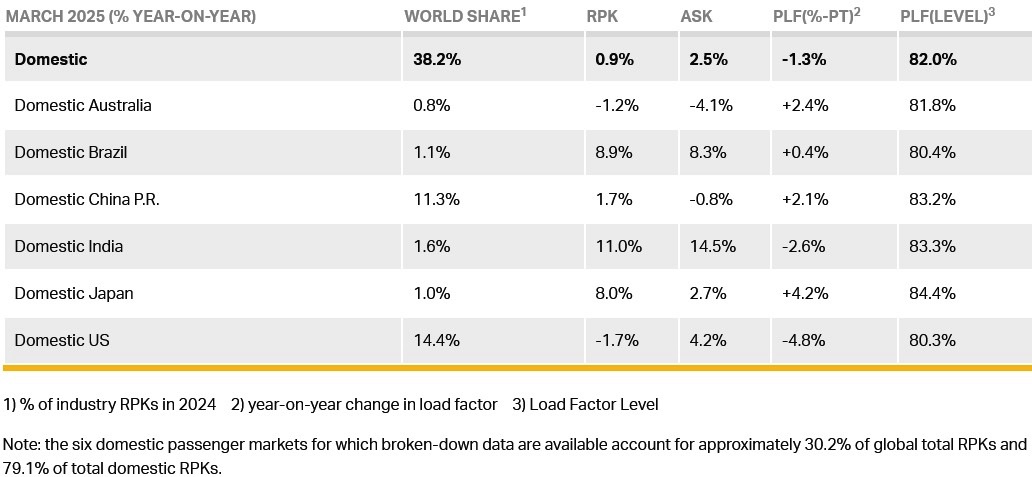
International demand rose 4.9% compared to March 2024. Capacity was up 7.0% year-on-year and the load factor was 79.9% (-1.7 ppt compared to March 2024). Domestic demand increased 0.9% compared to March 2024. Capacity was up 2.5% year-on-year. The load factor was 82.0% (-1.3 ppt compared to March 2024).

Willie Walsh (above), IATA’s Director General said: “Passenger demand grew by 3.3% year-on-year in March, a slight strengthening from the 2.7% growth reported for February. A capacity expansion of 5.3%, however, outpaced the demand expansion leading to a load factor decline from record highs to 80.7% systemwide.
"There remains a lot of speculation around the potential impacts of tariffs and other economic headwinds on travel. While the small decline in demand in North America needs to be watched carefully, March numbers continued to show a global pattern of growth for air travel. That means the challenges associated with accommodating more people who need to travel—specifically alleviating supply chain problems and ensuring sufficient airport and air traffic management capacity—remain urgent.”
Regional Breakdown - International Passenger Markets
International RPK growth slowed to 4.9% in March year-on-year from the 5.9% reported for February and from the 12.5% reported in January. This slowdown since January reflects in large part the final normalization of year-on-year demand comparisons post-COVID. Asia-Pacific was the strongest performer among regions with 9.9% growth. Load factors fell in every region, for a -1.7 ppt overall decline.
Asia-Pacific airlines reported a 9.9% year-on-year increase in demand. Capacity increased 11.6% year-on-year, and the load factor was 84.1% (-1.3 ppt compared to March 2024).
European carriers had a 4.9% year-on-year increase in demand. Capacity increased 6.9% year-on-year, and the load factor was 78.2% (-1.5 ppt compared to March 2024).
Middle Eastern carriers saw a -1.0% year-on-year decline in demand. Capacity increased 2.8% year-on-year, and the load factor was 74.6% (-2.9 ppt compared to March 2024). The decline in demand is likely related to the timing of Ramadan which impacts travel patterns.
North American carriers saw a -0.1% year-on-year fall in demand. Capacity increased 2.0% year-on-year, and the load factor was 83.0% (-1.8 ppt compared to March 2024). While demand had a second consecutive month of year-on-year contraction, it is important to note that this is an improvement on the -1.5% decline reported for February.
Latin American airlines saw a 7.7% year-on-year increase in demand. Capacity climbed 12.1% year-on-year. The load factor was 80.9% (-3.3 ppt compared to March 2024).
African airlines saw a 3.3% year-on-year increase in demand. Capacity was up 3.5% year-on-year. The load factor was 70.1% (-0.2 ppt compared to March 2024).
Domestic Passenger Markets
Domestic air travel posted a marginal 0.9% gain, weighed down by declines in the US and Australian markets. Brazil and India reported the strongest growth at 8.9% and 11.0% respectively. Meanwhile, Australia (-1.2%) and the US (-1.7%) reported declines. The load factor fell -1.3 ppt as domestic capacity expanded 2.5%.
Air Cargo
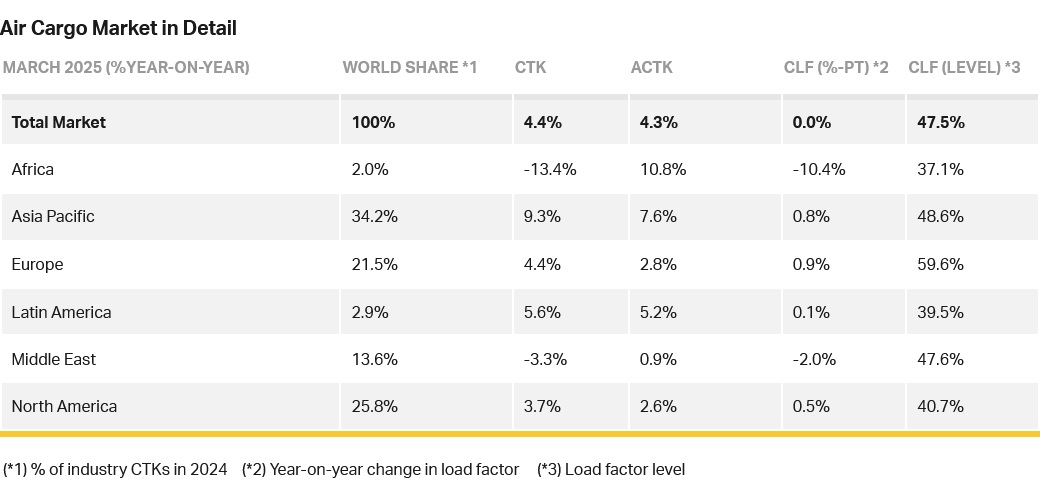
IATA data for global air cargo markets in March 2025 showed total demand, measured in cargo tonne-kilometres (CTK), increased by 4.4% compared to March 2024 levels (+5.5% for international operations), a historic peak for March.
Capacity, measured in available cargo tonne-kilometres (ACTK), expanded by 4.3% compared to March 2024 (+6.1% for international operations).
Willie said: “March cargo volumes were strong. It is possible that this is partly a front-loading of demand as some businesses tried to beat the well-telegraphed 2nd April tariff announcement by the Trump Administration. The uncertainty over how much of the 2nd April proposals will be implemented may eventually weigh on trade. In the meantime, the lower fuel costs—which are also a result of the same uncertainty—are a short-term positive factor for air cargo. Also, within the temporary pause on implementation we hope that political leaders will be able to shift trade tensions to reliable agreements that can restore confidence in global supply chains.”
Several factors in the operating environment should be noted:
- March volumes typically rise after a lull in February, and this single-digit increase is in line with pre-COVID growth trends.
- Jet fuel prices dropped 17.3% year-on-year, marking nine straight months of year-on-year declines.
- The sharp rise in US tariffs and new trade rules, especially the ban on duty-free imports from China and Hong Kong, may have prompted companies and buyers to make purchases in advance to avoid significant import fees.
- World industrial output grew 3.2% year-on-year and trade volumes expanded 2.9%. Many key Consumer Price Inflation (CPI) indices fell: US inflation was 2.4%, down 0.4 points from February, EU CPI was 2.5% and Japan’s rate fell 0.1% to 3.6%. China remains in deflation but this eased to -0.1%.
March Regional Performance
Asia-Pacific airlines saw 9.6% year-on-year demand growth for air cargo in March, the strongest growth among the regions. Capacity increased by 11.3% year-on-year.
North American carriers saw a 9.5% year-on-year increase in demand growth for air cargo in March. Capacity increased by 6.1% year-on-year.
European carriers saw a 4.5% year-on-year increase in demand growth for air cargo in March. Capacity increased 2.0% year-on-year.
Middle Eastern carriers saw a -3.2% year-on-year decrease in demand growth for air cargo in March. Capacity increased by 0.8% year-on-year. It’s possible the weakness in this market is due to year-on-year comparison with the strong growth at the start of 2024 resulting from disruption to Red Sea maritime freight.
Latin American carriers saw 5.8% year-on-year demand growth for air cargo in March. Capacity increased 4.7% year-on-year.
African airlines saw a -13.4% year-on-year decrease in demand for air cargo in March, the slowest among the regions. Capacity increased by 10.5% year-on-year.
Trade Lane Growth: The Europe-North America route was the busiest trade lane in March. The largest trade lane by market share, Asia-North America, also grew strongly, possibly encouraged by front-loading shipments ahead of potential increased tariffs. Europe-Middle East and Africa-Asia were the only trade lanes to decline in March.