IATA sees strong passenger demand and air cargo recovery continue in July

Image courtesy IATA
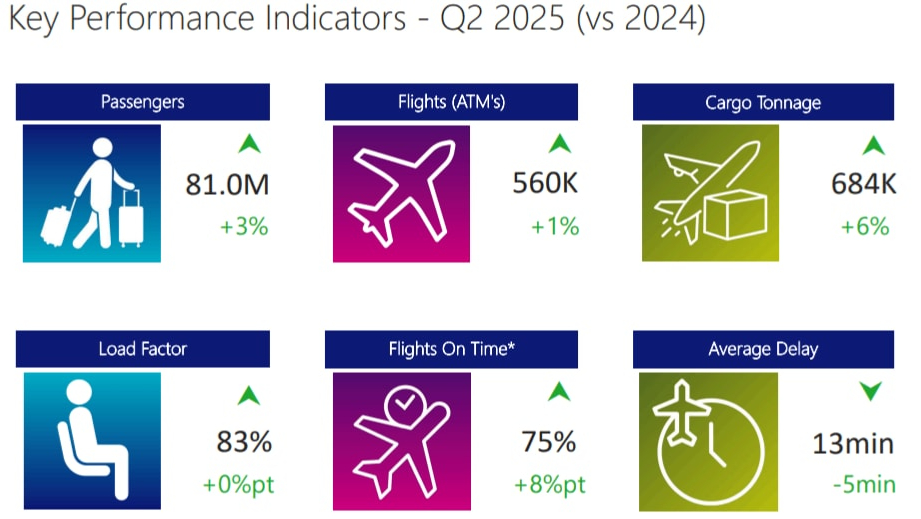
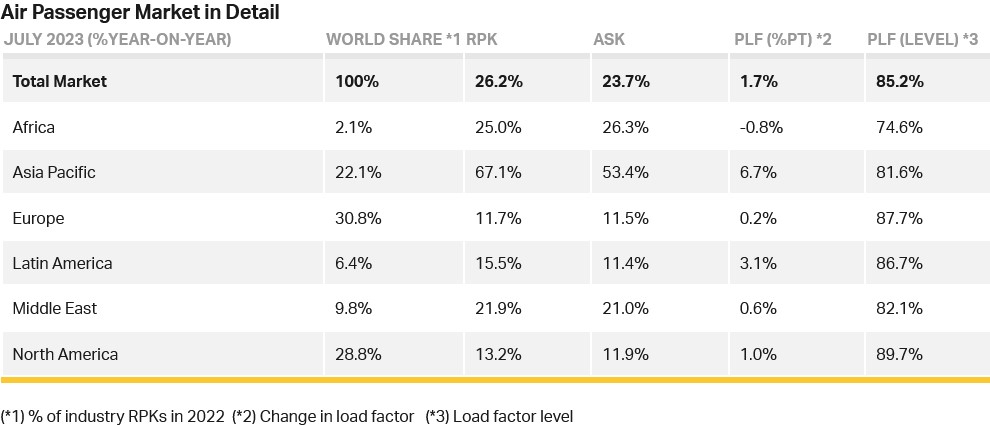
Total traffic in July 2023 (measured in revenue passenger kilometres or RPKs) rose 26.2% compared to July 2022. Globally, traffic is now at 95.6% of pre-COVID levels.
Domestic traffic for July rose 21.5% versus July 2022 and was 8.3% above the July 2019 results. July RPKs are the highest ever recorded, strongly supported by surging demand in the China domestic market.

International traffic climbed 29.6% compared to the same month a year ago with all markets showing robust growth. International RPKs reached 88.7% of July 2019 levels. The passenger load factor (PLF) for the industry reached 85.7% which is the highest monthly international PLF ever recorded.
Willie Walsh (above), IATA’s Director General said: “Planes were full during July as people continue to travel in ever greater numbers. Importantly, forward ticket sales indicate that traveller confidence remains high. And there is every reason to be optimistic about the continuing recovery.”
International Passenger Markets
Asia-Pacific airlines saw a 105.8% increase in July 2023 traffic compared to July 2022, continuing to lead the regions. Capacity climbed 96.2% and the load factor increased by 3.9 percentage points to 84.5%.
European carriers’ July traffic rose 13.8% versus July 2022. Capacity increased 13.6% and load factor edged up 0.1 percentage points to 87.0%.
Middle Eastern airlines posted a 22.6% increase in July traffic compared to a year ago. Capacity rose 22.1% and load factor climbed 0.3 percentage points to 82.6%.
North American carriers had a 17.7% traffic rise in July 2023 versus the 2022 period. Capacity increased 17.2% and load factor improved 0.3 percentage points to 90.3%, which was the highest among the regions for a second consecutive month.
Latin American airlines’ traffic rose 25.3% compared to the same month in 2022. July capacity climbed 21.2% and load factor rose 2.9 percentage points to 89.1%.
African airlines saw a 25.6% traffic increase in July 2023 versus a year ago, the second highest percentage gain among the regions. July capacity was up 27.4% and load factor fell 1.0 percentage point to 73.9%, the lowest among the regions. For a second month in a row, Africa was the only region to see capacity growth outrun traffic demand.
Domestic Passenger Markets
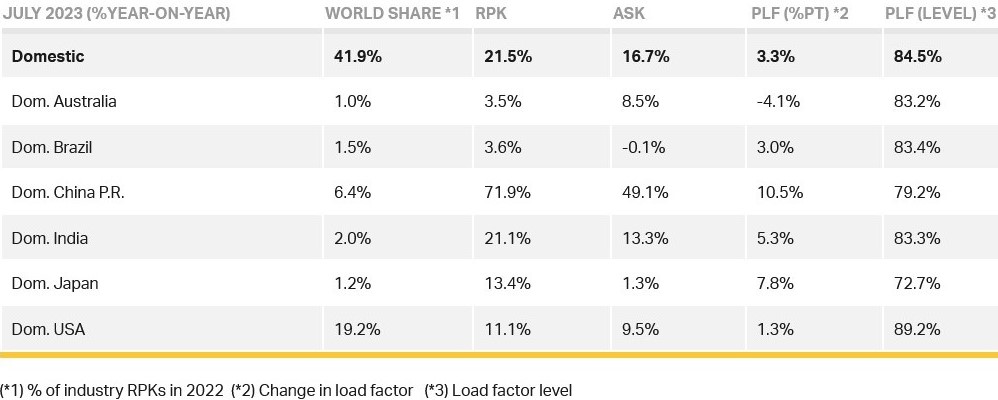
China’s domestic traffic jumped 71.9% in July compared to a year ago and is now 22.5% above July 2019 levels, which was the strongest gain against pre-pandemic levels among the domestic markets.
US airlines’ domestic demand climbed 11.1% in July and was 3.0% above the July 2019 level.
Walsh said: “The Northern Hemisphere summer is living up to expectations for very strong traffic demand. While the industry was largely prepared to accommodate a return to pre-pandemic levels of operations, unfortunately, the same cannot be said for our infrastructure providers. Performance of some of the key air navigations services providers, for example, has been deeply disappointing for many reasons from insufficient staffing to the failure fiasco of NATS in the UK. These must be promptly corrected.
"Even more worrying, however, are political decisions by some governments—among them Mexico and the Netherlands—to impose capacity cuts at their major hubs that will most certainly destroy jobs and damage local and national economies. The numbers continue to tell us that people want and need air connectivity. That’s why governments should be working with us so that people can travel safely, sustainably and efficiently.”
Air Cargo
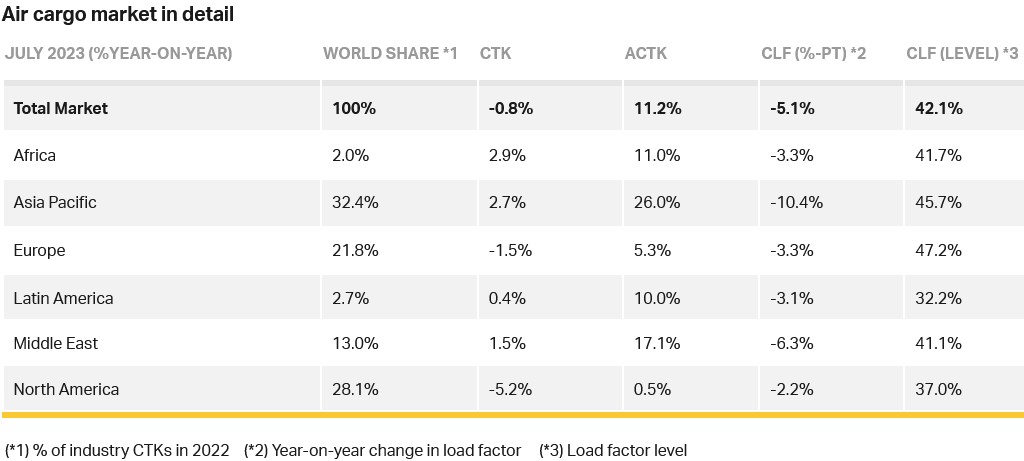
Air cargo demand in July was tracking just 0.8% below the previous year’s levels. Although demand is now basically flat compared to 2022, this is an improvement on recent months’ performance that is particularly significant given declines in global trade volumes and rising concerns over China’s economy.
Global demand, measured in cargo tonne-kilometres (CTKs*), tracked at 0.8% below July 2022 levels (-0.4% for international operations). This was a significant improvement over the previous month’s performance (-3.4%).
Capacity, measured in available cargo tonne-kilometres (ACTKs), was up 11.2% compared to July 2022 (8% for international operations). The strong uptick in ACTKs reflects the growth in belly capacity (29.3% year-on-year) due to the summer season.

Several factors in the operating environment should be noted:
- In July, both the manufacturing output Purchasing Managers Index or PMI (49.0) and new export orders PMI (46.4) were below the critical threshold represented by the 50 mark, indicating a decline in global manufacturing production and exports.
- Global cross-border trade contracted for the third month in a row in June, decreasing 2.5% year-over-year, reflecting the cooling demand environment and challenging macroeconomic conditions. The difference between the annual growth rates of air cargo and the global goods trade narrowed to -0.8 percentage points in June. While air cargo growth is still lagging world trade, the gap is the narrowest since January 2022.
- In July, the global supplier delivery time PMI was 51.9, signaling fewer supply chain delays. All major economies, except China, had PMIs above 50. The US, Europe, and Japan recorded PMIs of 54.2, 57.7 and 50.4, respectively.
- Inflation saw a mixed picture in July, with the increase in US consumer prices picking up pace for the first time in 13 months. Meanwhile, in China, both consumer and producer prices fell, pointing to a possible deflationary economy.
Walsh said: "Compared to July 2022, demand for air cargo was basically flat. Considering we were 3.4% below 2022 levels in June, that’s a significant improvement. And it continues a trend of strengthening demand that began in February. How this trend will evolve in the coming months will be something to watch carefully. Many fundamental drivers of air cargo demand, such as trade volumes and export orders, remain weak or are deteriorating. And there are growing concerns over how China’s economy is developing. At the same time, we are seeing shorter delivery times, which is normally a sign of increasing economic activity. Amid these mixed signals, strengthening demand gives us good reason to be cautiously optimistic."
July Regional Performance
Asia-Pacific airlines saw their air cargo volumes increase by 2.7% in July 2023 compared to the same month in 2022. This was a significant improvement in performance compared to June (-3.3%). Carriers in the region benefited from growth on three major trade lanes: Europe-Asia (3.2% year-on-year growth), Middle East-Asia (up from 1.8% in June to 6.6% in July), and Africa-Asia (returning to double-digit growth of 10.3% year-on-year from -4.8% in June). Additionally, the within-Asia trade lane also performed considerably better in July, with an annual decline of international CTKs at 7.5% compared with the double-digit decreases observed since September 2022. Available capacity in the region increased by 26.0% compared to July 2022 as more belly capacity came online from the passenger side of the business.
North American carriers posted the weakest performance of all regions, with a 5.2% decrease in cargo volumes in July 2023 compared to the same month in 2022, marking the fifth consecutive month in which the region had the weakest performance. It was, however, a slight improvement compared to June (-5.9%). The transatlantic route between North America and Europe saw traffic declining by 4.3% in July, 1.2 percentage points worse than the previous month. Capacity increased 0.5% compared to July 2022.
European carriers saw their air cargo volumes decline by 1.5% in July compared to the same month in 2022. This was, however, an improvement in performance versus June (-3.2%). Volumes were affected due to the aforementioned Europe–
North America performance and contractions in the Middle East-Europe (-1.2%) and the within-Europe (-5.1%) markets. Capacity increased 5.3% in July 2023 compared to July 2022.
Middle Eastern carriers experienced a 1.5% year-on-year increase in cargo volumes in July 2023. This was also an improvement to the previous month’s performance (0.6%). The demand on Middle East–Asia routes has been trending upward in the past two months. Capacity increased 17.1% compared to July 2022.
Latin American carriers posted a 0.4% increase in cargo volumes compared to July 2022. This was a drop in performance compared to the previous month (2.2%). Capacity in July was up 10.0% compared to the same month in 2022.
African airlines had the strongest performance in July 2023, with a 2.9% increase in cargo volumes compared to July 2022. Notably, Africa–Asia routes experienced significant cargo demand growth (10.3%). Capacity was 11.0% above July 2022 levels.