IATA reports air passenger and cargo demand growth in September

Image courtesy IATA
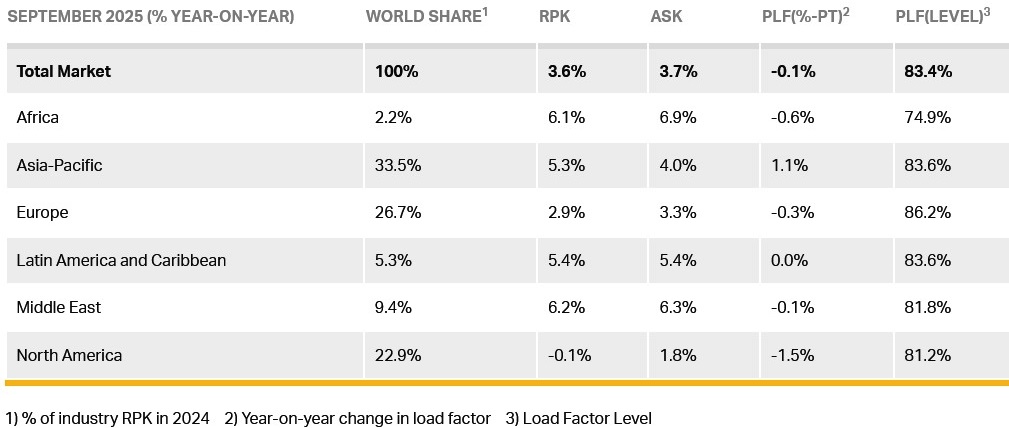
Total passenger demand, measured in revenue passenger kilometres (RPK), was up 3.6% compared to September 2024. Total capacity, measured in available seat kilometres (ASK), was up 3.7% year-on-year.
The September load factor was 83.4% (-0.1 ppt compared to September 2024).
International demand rose 5.1% compared to September 2024 and capacity was up 5.2% year-on-year and the load factor was 83.6% (-0.1 ppt compared to September 2024).

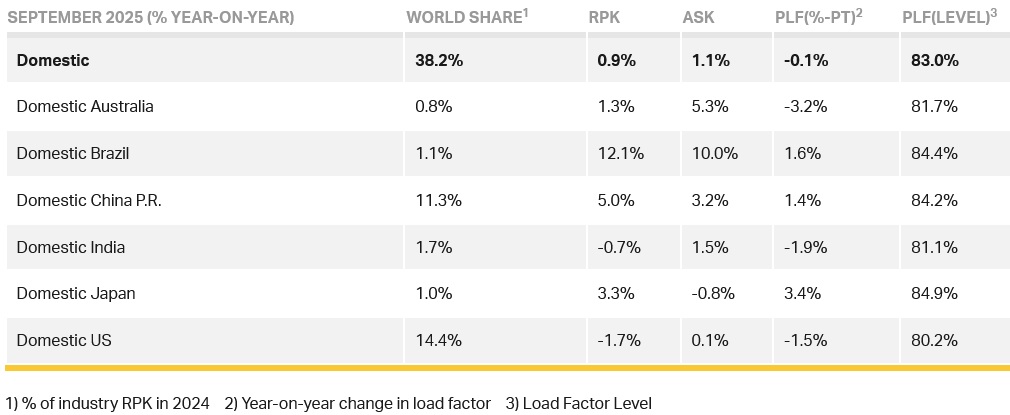
Domestic demand increased 0.9% compared to September 2024. Capacity was up 1.1% year-on-year. The load factor was 83.0% (-0.1 ppt compared to September 2024).
Willie Walsh (above), IATA’s Director General, said: “Solid international demand drove 90% of September’s 3.6% overall growth. Importantly, the capacity expansion slightly nudged ahead of demand growth at 3.7%. Load factors, nonetheless, remained very strong at 83.4%.
"With November flight schedules indicating a 3% expansion on the previous year, airlines are gearing up for continued growth into the year-end holiday season. This is despite the severe constraints of unresolved supply chain issues.”
Air Passenger Market in Detail
Regional Breakdown - International Passenger Markets
International RPK growth reached 5.1% in September year-on-year, and growth was seen in all regions. The only region to show a significant load factor improvement was Asia-Pacific.
Asia-Pacific airlines achieved a 7.4% year-on-year increase in demand. Capacity increased 6.1% year-on-year, and the load factor was 83.3% (+1.0 ppt compared to September 2024). Intra-Asia travel was the strongest driver of growth with a 9.4% increase, led primarily by traffic from China and Japan.
European carriers had a 4.0% year-on-year increase in demand. Capacity increased 4.4% year-on-year, and the load factor was 85.6% (-0.3 ppt compared to September 2024).
North American carriers saw a 2.5% year-on-year increase in demand. Capacity increased 4.3% year-on-year, and the load factor was 82.9% (-1.5 ppt compared to September 2024). The North America-Asia corridor showed weak growth of just 0.9%. By contrast, North America-South America traffic bounced back from its August decline, with growth of 1.1%.
Middle Eastern carriers saw a 6.3% year-on-year increase in demand. Capacity increased 6.2% year-on-year, and the load factor was 81.9% (unchanged compared to September 2024).
Latin American airlines saw a 5.3% year-on-year increase in demand. Capacity climbed 6.8% year-on-year. The load factor was 83.3% (-1.2 ppt compared to September 2024).
African airlines saw a 5.3% year-on-year increase in demand. Capacity was up 5.1% year-on-year. The load factor was 74.7% (+0.1 ppt compared to September 2024).
Domestic Passenger Markets
Domestic RPK rose 0.9% over September 2024 and load factor fell by 0.1 ppt to 83.0% on the back of a 1.1% capacity expansion. Brazil continues to lead the way with a double-digit expansion. By contrast, the decline in US domestic travel accelerated to -1.7% and its load factor is the weakest of the major domestic markets.
Air Cargo
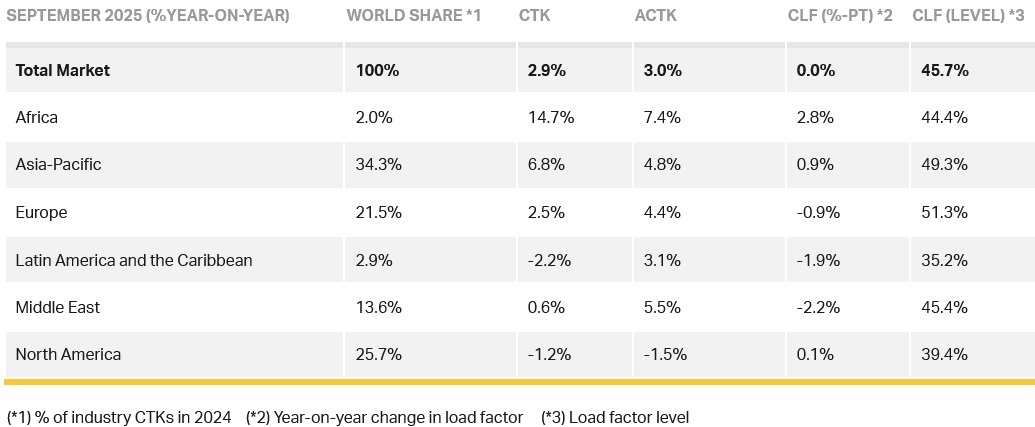
IATA data for September 2025 global air cargo markets showed total demand, measured in cargo tonne-kilometres (CTK), rose by 2.9% compared to September 2024 levels (+3.2% for international operations). Capacity, measured in available cargo tonne-kilometres (ACTK), increased by 3.0% compared to September 2024 (+4.4% for international operations).

Willie said: “Air cargo demand grew 2.9% year-on-year in September, marking the seventh consecutive month of overall growth. Buried in that growth is a significant alteration of trade patterns as US tariff policies, including the ending of de minimis exemptions, kick in.
"On one side of the equation, a decline in North America-Asia demand has set in over the last five months. But this has been more than compensated for with strong growth within Asia and on routes linking Asia to Europe, Africa and the Middle East. While many had feared an unwinding of global trade, we are instead seeing air cargo adapting successfully to serve shifting market demands.”
Several factors in the operating environment should be noted:
- The global goods trade grew by 7% year-on-year in August.
- Jet fuel prices rose 5.4% in September despite lower oil prices, driven by a tighter diesel market, which doubled the crack spread year-on-year.
- Global manufacturing sentiment strengthened in September, with the PMI rising for the second straight month to reach 51.3. New export orders improved slightly to 49.6 but remained below the 50-point expansion threshold, reflecting ongoing caution amid tariff uncertainty.
Air Cargo Market in Detail
September Regional Performance
Asia-Pacific airlines saw a 6.8% year-on-year growth in air cargo demand in September. Capacity increased by 4.8% year-on-year.
North American carriers saw a 1.2% year-on-year decrease in growth for air cargo in September. Capacity decreased by 1.5% year-on-year.
European carriers saw a 2.5% year-on-year increase in demand for air cargo in September. Capacity increased 4.4% year-on-year.
Middle Eastern carriers saw a 0.6% year-on-year increase in demand for air cargo in September. Capacity increased by 5.5% year-on-year.
Latin American carriers saw a 2.2% year-on-year decrease in demand for air cargo in September, the slowest growth of all regions. Capacity increased by 3.1% year-on-year.
African airlines saw a 14.7% year-on-year increase in demand for air cargo in September, the strongest rise of all regions. Capacity increased by 7.4% year-on-year.
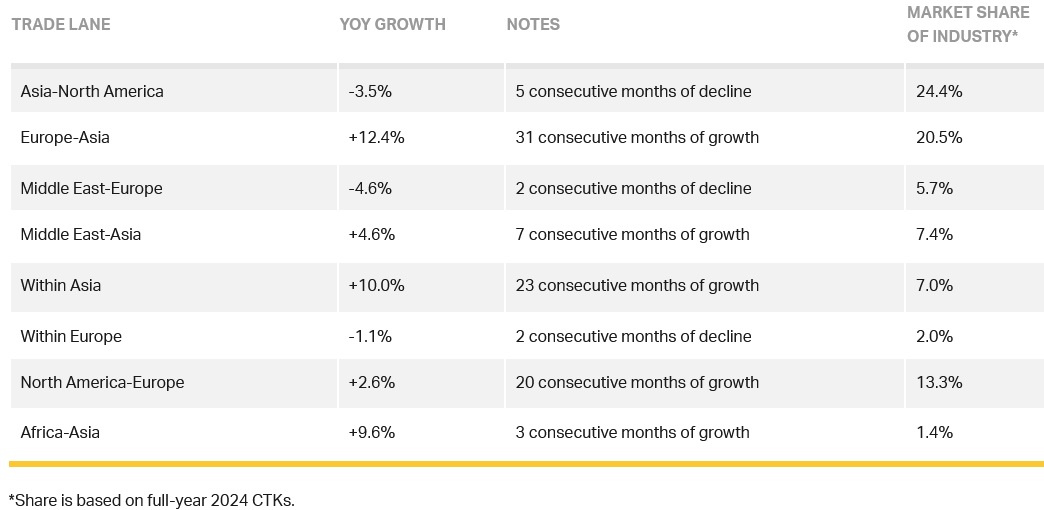
Trade Lane Growth
Air freight volumes in September 2025 increased across most major trade corridors. Europe–Asia and Within Asia posted robust double-digit growth, while Middle East–Asia, North America-Europe, and Africa-Asia also saw notable gains. In contrast, Asia–North America, Middle East–Europe and Within Europe recorded declines.