IATA sees passenger and cargo demand growth over 4% in August

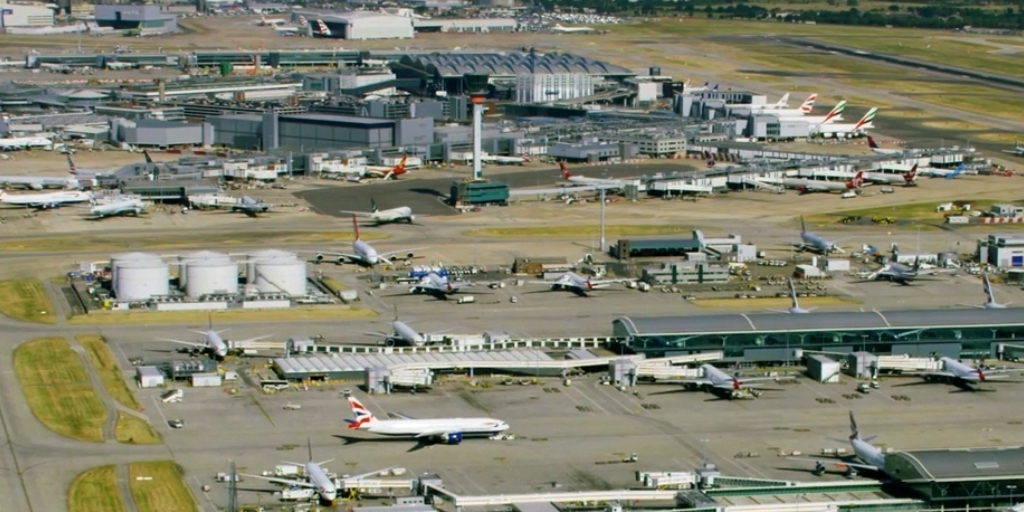
Image courtesy IATA
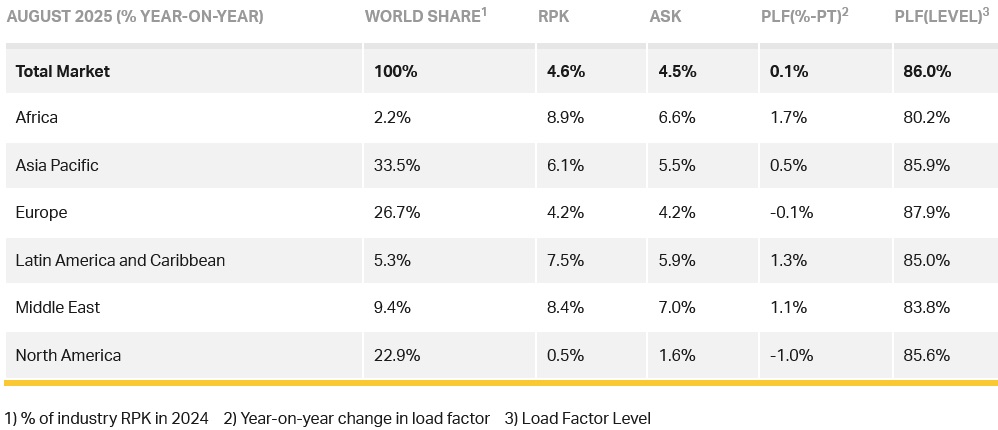
Total capacity, measured in available seat kilometres (ASK), was up 4.5% year-on-year. The August load factor was 86.0% (+0.1 ppt compared to August 2024), a record high for the month.
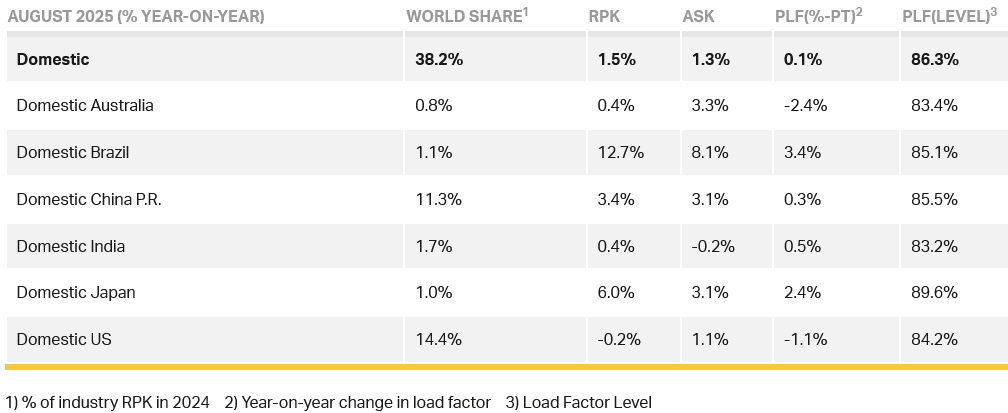
International demand rose 6.6% compared to August 2024, capacity was up 6.5% year-on-year and the load factor was 85.8% (+0.1 ppt compared to August 2024). Domestic demand increased 1.5% compared to August 2024 and capacity was up 1.3% year-on-year. The load factor was 86.3% (+0.1 ppt compared to August 2024).

Willie Walsh (above), IATA’s Director General said: “August year-on-year demand growth of 4.6% confirms that the 2025 peak northern summer travel season reached a new record high. Moreover, planes were operating with more seats filled than ever with a record load factor of 86%. Despite economic uncertainties and geopolitical tensions, the global growth trend shows no signs of abating, as October schedules are showing airlines planning 3.4% more capacity.
"Airlines are doing their best to meet travel demand by maximising efficiency, making it even more critical for the aerospace manufacturing sector to sort out its supply chain challenges.”
Air Passenger Market in Detail
Regional Breakdown - International Passenger Markets
International RPK growth reached 6.6% in August year-on-year, and load factor reached a historic high. International traffic was by far the dominant driver of growth, accounting for 87% of the net increase in global RPK in August.
Asia-Pacific airlines achieved a 9.8% year-on-year increase in demand. Capacity increased 9.5% year-on-year, and the load factor was 85.1% (+0.2 ppt compared to August 2024). Growth was driven by strong demand from China and Japan (+11.8% and +12% respectively).
European carriers had a 5.3% year-on-year increase in demand. Capacity increased 5.3% year-on-year, and the load factor was flat (0.0 ppt compared to August 2024).
North American carriers saw a 1.8% year-on-year increase in demand. Capacity increased 2.6% year-on-year, and the load factor was 87.5% (-0.6 ppt compared to August 2024). This was the fourth consecutive month of YoY declines in international PLF for North America.
Middle Eastern carriers saw an 8.2% year-on-year increase in demand. Capacity rose by 6.9% year-on-year, and the load factor was 83.9% (+1.0 ppt compared to August 2024).
Latin American airlines saw a 9.0% year-on-year increase in demand. Capacity climbed 9.3% year-on-year. The load factor was 84.7% (-0.2 ppt compared to August 2024).
African airlines saw a 7.1% year-on-year increase in demand. Capacity was up 5.3% year-on-year. The load factor was 79.7% (+1.3 ppt compared to August 2024).
Domestic Passenger Markets
Domestic RPK rose 1.5% over August 2024 and contributed only 13% of the global increase in August RPK, down from 25% a year ago. US domestic load factor fell YoY for the eighth consecutive month. The sharp expansion in Brazil was helped by government efforts to promote tourism.
AIR CARGO
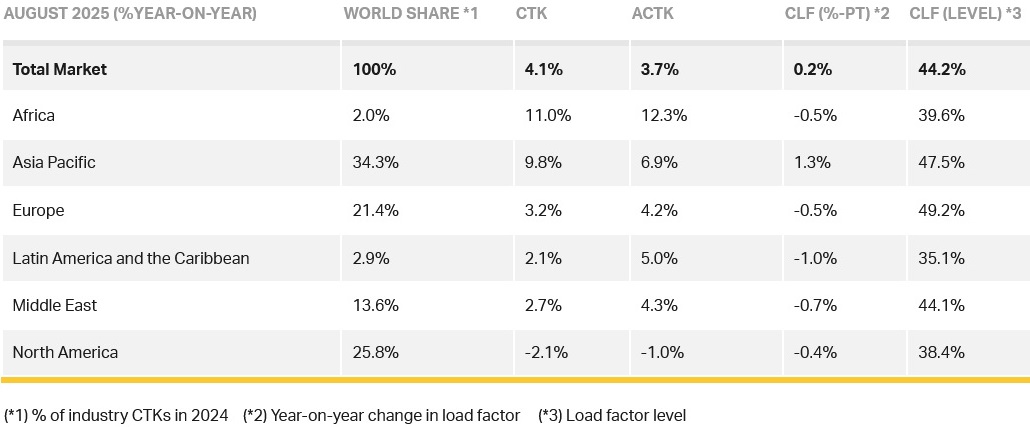
IATA data for August 2025 for global air cargo markets showed total demand, measured in cargo tonne-kilometres (CTK), rose by 4.1% compared to August 2024 levels (+5.1% for international operations), with capacity, measured in available cargo tonne-kilometres (ACTK), having increased by 3.7% compared to August 2024 (+5.5% for international operations).
Walsh said: “Air cargo demand grew 4.1% in August, marking the sixth consecutive month of year-on-year growth. Volumes continue to grow even as global trade patterns change. Air cargo has benefitted from a shift from sea for some high value goods as shippers try to minimise the risk of tariff changes. And growth patterns indicate some being diverted away from North America, fueling stronger growth for the Europe–Asia, Within Asia, Africa–Asia and Middle East–Asia trade lanes. This adaptability is vital as shippers navigate the evolving landscape of US tariff policy."
Several factors in the operating environment should be noted:
- The global goods trade grew by 4% year-on-year in July.
- Jet fuel prices in August were 6.4% lower year-on-year, marking the fourteenth consecutive month of year-on-year declines.
- Global manufacturing in August showed rising optimism in manufacturing PMI, with a rebound to 51.75, the strongest reading since June 2024. Sentiment on new export orders, however, remains below 50 at 48.73, reflecting persistent caution amid tariff uncertainty.
Air Cargo Market in Detail
August Regional Performance
Asia-Pacific airlines saw a 9.8% year-on-year growth in air cargo demand in August. Capacity increased by 6.9% year-on-year.
North American carriers saw a 2.1% year-on-year decrease in growth for air cargo in August, the slowest growth of all regions. Capacity decreased by 1.0% year-on-year.
European carriers saw a 3.2% year-on-year increase in demand for air cargo in August. Capacity increased 4.2% year-on-year.
Middle Eastern carriers saw a 2.7% year-on-year increase in demand for air cargo in August. Capacity increased by 4.3% year-on-year.
Latin American carriers saw a 2.1% year-on-year increase in demand for air cargo in August. Capacity increased by 5.0% year-on-year.
African airlines saw a 11.0% year-on-year increase in demand for air cargo in August, the strongest rise of all regions. Capacity increased by 12.3% year-on-year.
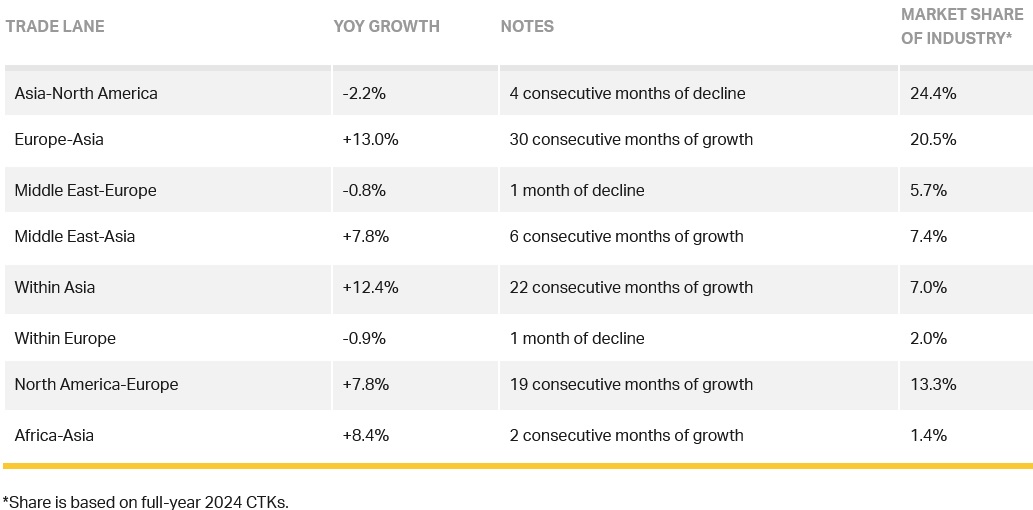
Trade Lane Growth
Air freight volumes in August 2025 increased significantly across most major trade corridors. Europe–Asia and Within Asia posted robust double-digit growth, while Middle East–Asia, North America-Europe, and Africa-Asia also saw notable gains. In contrast, Asia–North America, Middle East–Europe, and Within Europe recorded declines.